4.1 PX4
PX4 supports terminal access to the system via MAVLink Shell and the system console.
The PX4 System Console provides low-level access to the system, debug output, and analysis of the system boot process:
There is only one system console, which runs on a specific UART (the debug port, as configured in NuttX) and is usually connected to the computer via an FTDI cable (or some other debug adapter, such as the Zubax BugFace BF1 ).
- Used for low-level debugging/development: booting, NuttX, startup scripts, board booting, development of core parts of PX4 (e.g. uORB).
- In particular, this is the only place where all startup output (including information about applications that start automatically at boot) is printed.
MAVLink Shell provides higher-level access to the system:
- For basic module testing/running commands.
- Only output from modules that you directly start is displayed.
- There is no way to directly display the output of tasks running on a work queue.
- It is not possible to debug a problem when the system is not started (because it is not yet running).
There can be multiple shells, either running on a dedicated UART or via MAVLink. Currently only the MAVLink Shell is used, as MAVLink offers greater flexibility .
The System Console is essential if the system fails to boot (it displays the system boot log when the board is powered off and on). MAVLink Shell is easier to set up and is generally recommended for most debugging.
MAVLink Shell
MAVLink Shell is an NSH console that can be accessed via MAVLink over a serial (USB/Telemetry) or Wi-Fi (UDP/TCP) link (specifically on NuttX based systems like Pixhawk, Pixracer, etc).
- FC USB to PC
The shell can be used to run commands and modules and display their output. Although the shell cannot directly display the output of modules it has not started, it can dmesg display it indirectly using the command ( dmesg -f & which can be used to display the output of other modules and tasks running in the work queue).
Via the QGroundControl MAVLink Console
The easiest way to access the shell is to use the QGroundControl MAVLink console (see Analyze View > Mavlink Console ). The console only works when connected to hardware running the PX4 flight stack. PX4 SITL and ArduPilot are not supported.
This feature is very useful for developers because it allows deep access to the system. In particular, if you are connected via Wi-Fi, you can gain the same level of access as when the aircraft is flying.
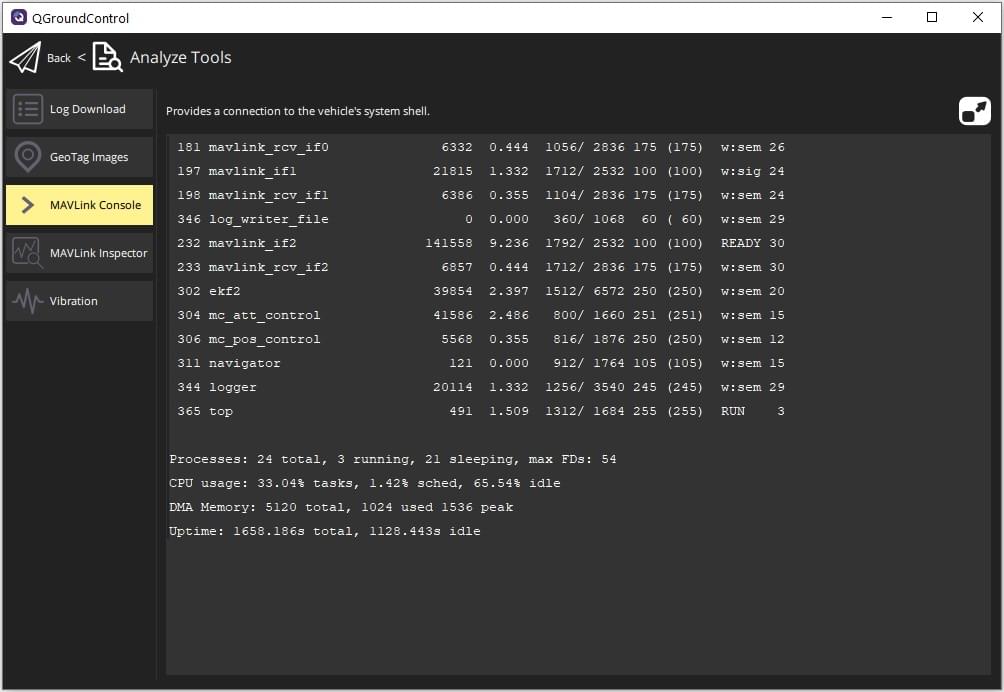
The view does not display any output unless in response to a command. Once the vehicle is connected, you can enter commands in the field provided (to see a full list of available commands, enter ) ?.
The command output is displayed in the view above the command bar. Click **Show Latest** to jump to the bottom of the command output.
Through the PX4-Autopilot source code comes with
You can also access the shell in a terminal using the mavlink_shell.py script:
- Close QGroundControl.
- Install dependencies:
pip3 install --user pymavlink pyserial - Open Terminal (in the PX4-Autopilot directory) and start a shell:
# For serial port
./Tools/mavlink_shell.py /dev/ttyACM0
# For Wifi connection
./Tools/mavlink_shell.py 0.0.0.0:14550
Gets mavlink_shell.py -h a description of all available parameters.
PX4 System Console
The PX4 System Console provides low-level access to the system, debug output, and analysis of the system boot process.
Connecting
- FC Debug connected to PC diagram
The console is connected via a (board-specific) UART connection, which can be connected to a computer USB port using a 3.3V FTDI cable. This allows the console to be accessed using a terminal application.
Pixhawk controller manufacturers should expose console UART and SWD (JTAG) debug interfaces through dedicated debug ports that conform to the Pixhawk connector standard. Unfortunately, some development boards predate or do not conform to this standard.
The following sections outline/link to wiring and system console information for many common boards.
Board-Specific Wiring
The system console UART pinout/debug port is generally documented on the autopilot overview page (some of which are linked below):
- 3DR Pixhawk v1 flight controller (also works with mRo Pixhawk, Holybro Pix32 )
- Pixhawk 3
- Pixracer
Pixhawk Debug
Pixhawk flight controllers are usually equipped with a Pixhawk connector standard debug port, which can be a 10-pin Pixhawk Debug Full port or a 6-pin Pixhawk Debug Mini port.
These ports have pins for console TX and RX, which can be connected to an FTDI cable. The Pixhawk Debug Mini to FTDI mapping is shown below.
| Pixhawk debug port | - | FTDI | - |
|---|---|---|---|
| 1 (red) | Target processor voltage | N/C (for SWD/JTAG debugging) | |
| 2 (black) | Console TX (output) | 5 | FTDI RX (yellow) |
| 3 (black) | Console RX (Input) | 4 | FTDI TX (orange) |
| 4 (black) | SWDIO | N/C (for SWD/JTAG debugging) | |
| 5 (black) | SWCLK | N/C (for SWD/JTAG debugging) | |
| 6 (black) | GND | 1 | FTDI GND (black) |
The SWD Debug Port page and the separate Flight Controller page contain more information on the debug port pinout.
Opening the System Console
Once the console connection is established, use the default serial port tool of your choice or the default tool described below:
For example, to install the screen tool on Ubuntu:
sudo apt-get install screen
- Serial port: Pixhawk v1 / Pixracer uses 57600 baud
Connect screen to the correct serial port with baud rate of BAUDRATE, data bits of 8, and stop bits of 1 (play around with it ls /dev/tty* and observe how it changes when you unplug/replug the USB device). Common names on Linux systems are /dev/ttyUSB0 and, and on Mac OS systems are./dev/ttyACM0``/dev/tty.usbserial-ABCBD
screen /dev/ttyXXX BAUDRATE 8N1
use the PX4 system console/MAVLink Shell
The MAVLink shell/console and the system console are used in much the same way.
For example, type ls to view the local file system, free view remaining available RAM, and dmesg view boot output.
Following are some commands that you can use in NuttShell to understand your system.
This NSH command provides the remaining available memory:
free
The top command shows the stack usage of each application:
top
Note that stack usage is calculated via stack coloring and is the maximum value since the task started (not the current usage).
To see what is running in the work queue and at what rate, use:
work_queue status
To debug a uORB topic:
uorb top
To check for a specific uORB topic:
listener <topic_name>
top Many other system commands and modules (such as, etc.) are listed in Module and Command Reference listener.
More
Please refer to the official PX4 documentation https://docs.px4.io/main/en/debug/consoles.html